
Why Real-Time Soil Intelligence Rarely Looks Like a Soil Test
One of the most common reactions we hear from agronomists and growers when they first start using UnderGround Weather is:
“I wasn’t expecting the data to look like that.”
At first glance, that might sound like a concern. In reality, it’s often the beginning of a much deeper understanding of what’s happening beneath the soil surface.
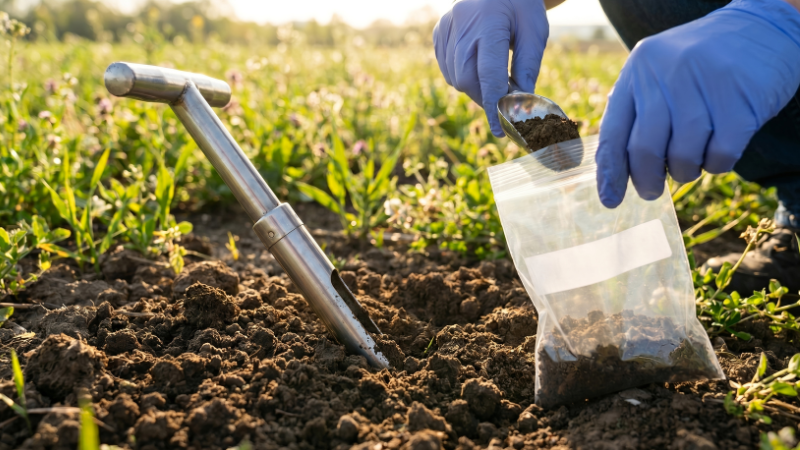
The reason is simple: most of us have spent our careers looking at snapshots. Soil cores, tissue samples, petiole tests, and laboratory analyses provide valuable information, but they capture a single moment in time. They tell us what conditions looked like on the day the sample was collected.
UnderGround Weather is different. Instead of a snapshot, it provides a continuous view of how soil conditions change hour by hour and day by day. For many agronomists, it’s the first time they’ve been able to watch nutrients move, accumulate, dilute, disappear, and reappear within the root zone. That shift from static measurements to dynamic observations can be surprising.
One of the biggest surprises is that nitrate is rarely distributed evenly throughout the soil profile. Many people expect nitrate levels to be relatively similar from one depth to another. Instead, they often discover nitrate concentrated in one layer while another layer shows very little. This isn’t a sensor anomaly—it reflects how nutrients actually behave underground. Fertilizer placement, irrigation, rainfall, soil texture, root activity, and microbial processes all influence where nitrate is located at any given moment.
Another surprise is how quickly conditions can change. A soil test collected on Monday may look very different from conditions on Thursday after an irrigation event, a rainfall event, or a period of rapid crop uptake. What appears stable in periodic sampling often reveals itself to be highly dynamic when observed continuously.
Many users also expect nutrient trends to move in straight lines. Instead, they see nitrate levels rise, fall, plateau, and fluctuate over time. That’s because soil is a living system. Crops are constantly taking up nutrients. Microbes are transforming nitrogen into different forms. Water is moving nutrients throughout the profile. Every line on the graph represents multiple biological, chemical, and physical processes interacting simultaneously.
Perhaps the most important realization is that real-time soil intelligence isn’t designed to confirm what we already believe. It’s designed to reveal what we couldn’t previously see.
Sometimes the data validates our assumptions. Sometimes it challenges them. In both cases, the result is better decision-making.
As agronomists, we have always relied on experience, observation, and periodic sampling to understand what is happening underground. Real-time soil intelligence adds a new layer of visibility. It allows us to move from asking, “What did conditions look like when I sampled?” to asking, “What has been happening in this field all week?”
That distinction is powerful.
Because once you can see what is actually happening underground, you can stop managing based on assumptions and start managing based on evidence.
And that’s often when people realize the data wasn’t wrong—it was simply showing them something they had never been able to see before.