How to Improve Crop Yield
Let’s start with this fact: maximizing crop yield doesn’t mean you will maximize your profitability. Too often, a farmer will think that maximizing yield is the goal. When in reality that goal can have a negative impact, not only on profitability, but also result in unnecessary application of costly and potentially limited resources like water.
Factors affecting crop yield
Aside from weather, there are four inputs or investments that can affect crop yield, but more importantly, farm profitability.
- Nutrients / Nitrogen
- Water
- Seed
- Insurance
To optimize your profits, managing your inputs effectively is key. You want to apply an adequate amount of inputs, but you don’t want to go too high. Historically, most farmers are slightly risk adverse and would rather slightly over apply inputs “just to be safe”, because it is well-known that underapplication will result in poor yields. However, in reality, it’s no longer either practical nor cost-effective to over apply inputs. Particularly, as water resources become increasingly constrained, and the risks of nutrient run-off become more apparent, it’s time to think of ways to hit yield targets without over-watering or over-apply nutrients.
Think in terms of input efficiency. You want to adjust all four of your throttles and aim for optimization.
The good news is that University of Nebraska has been running studies since 2017 that demonstrate how this can be achieved with the right combination of inputs and technology such as AquaSpy that helps inform better decisions around nutrient and water applications.
What UNL Taps competitions reveal
The University of Nebraska Testing Ag Performance Solutions (UNL-TAPS) is an innovative program developed by University of Nebraska research and extension specialists and educators. The program facilitates a number of interactive real-life farm management competitions. The studies are all remote, meaning the farmers made all their decisions without visiting the fields.
In the UNL Taps 2017 competition the second place farm used HALF as much irrigation as first place, and saw a slightly smaller yield than first place, but a much higher profit (18%). The team in last place used more water AND more nitrogen which actually hindered the yield and resulted in the second highest loss per acre. What was the secret? The most profitable fields used technology to drive their decisions and were able to see exactly when the crop was ready to consume critical nutrients so they could time that application precisely and with exactly enough of the critical inputs – water and nutrients.
In 2018 we see similar results, in fact the third highest efficiency rating used only 1 inch of irrigation, and the least nitrogen. Farms using 10 times more water and high amounts of nitrogen came in at the bottom of the efficiency ratings.
In 2019 these trends repeated. The highest efficiency rating was achieved with only 2 inches of irrigation and a fairly low nitrogen application whereas high level of irrigation and nitrogen application fell at the bottom of the efficiency ratings. Across all of these wide variances in yields.
Read the UNL Taps Reports here.
Timing is Key to Crop Yield Optimization
The only way you’ll be able to hit high efficiency ratings is by managing the timing of your inputs as well as the amount. First, you need to know how much available moisture is in the soil at the depth where the roots need it. Second, you need to know where that active root zone is, and how well the crop is consuming it. If you are pouring on water and the crop doesn’t need it or can’t consume it, you can end up harming your yield. On top of that, the timing of the application is important too, particularly for critical periods like tasseling or fruiting.
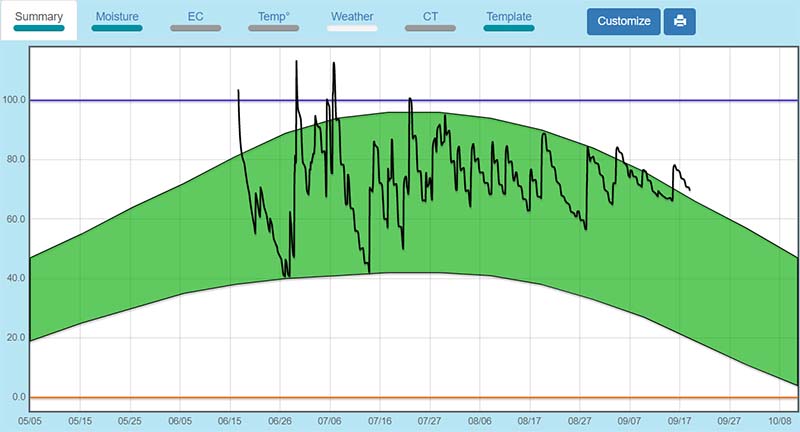
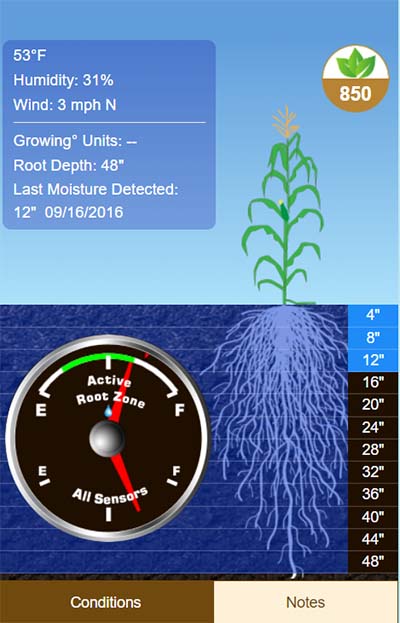
AquaSpy’s easy to install probes capture data at 4-inch intervals and send that via wireless cellular connection to a mobile device or desktop. Easy to read fuel gauge and summary charts tell the farmer what’s happening in the active root zone at the time and how far the last irrigation has reached.

In the summary chart’s curved green band, if you are moving the black lines on the chart sideways and in evenly matched up and down lines, you are balancing supply (downward line indicating water) and demand (upward line showing consumption by the crop). Your variability goes down when you balance supply and demand and this eliminates waste in inputs like water while optimizing yields. The green band is uniquely curved for each crop type to reflect critical periods of consumption during the growing season. Alerts will tell you if you’ve hit the fill point or the full point.

The proprietary numeric YES! Score in the upper right of the Fuel Gauge chart is an 850-point numerical representation of how well you stayed in the green band. To optimize yield stay in the green band and keep your score high.
Bottom line – Maximum yield isn’t always the right goal. What you want to focus on is profit per acre.
Related articles: Read why volumetric water measurement is a fallacy.

